🌵 Lesson Plan: Data Collection & Visualization through Desert Habitats
Target age: 5–6 years
Duration: 30–40 minutes
Learning Areas: Science, Numeracy, Geography, IB PYP Sharing the Planet
Learning Objectives
By the end of this lesson, students will:
- Understand that deserts can be hot or cold.
- Know that deserts receive very little rain.
- Compare simple numbers using desert rainfall data (in inches).
- Understand the number line and number relationships
- Practice simple graphing and counting skills.
- Practice visual representation of data and concepts

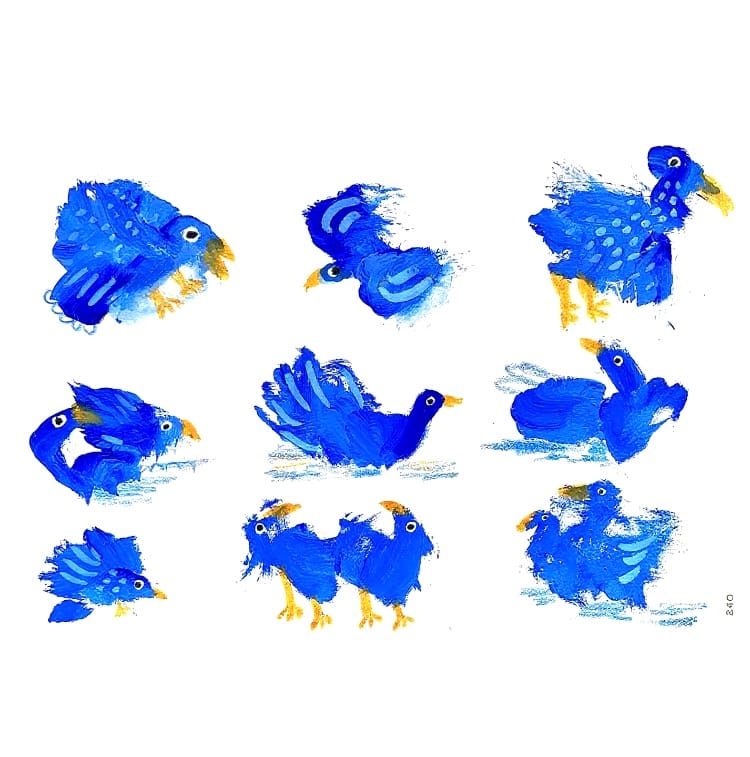
Activity worksheet: the learners filled in the number of “raindrops” to represent their understanding of numbers and how much rain each type of desert receives. They also drew a picture of the desert type as a way to visually represent an idea e.g. a sun for “hot and dry”, snowflake for “cold” etc.
🏜️ 1. Introduction to Deserts (10 mins)
Materials: Desert pictures or a storybook like “Way Out in the Desert” by T.J. Marsh
- Ask:
- “What is a desert?”
- “Is it always hot in the desert?”
- “What kinds of animals might live there?”
- Explain briefly:
Deserts are places that get very little rain.
There are 4 main types of deserts:- Hot and Dry
- Cold
- Coastal
- Arid
Show pictures of each desert type and talk about what they might feel like.
💧 2. Rainfall Data Exploration (10 mins)
Simplified average rainfall per year in each desert type (in inches):
| Desert Type | Rainfall per Year (approx.) |
|---|---|
| Hot and Dry | 1 inch |
| Cold | 6 inches |
| Coastal | 4 inches |
| Arid | 10 inches |
Differentiated for advanced learners with number ranges and “more than / less than”:
| Desert Type | Rainfall per Year (approx.) |
|---|---|
| Hot and Dry | less than 10 inches |
| Cold | less than 10 inches |
| Coastal | 3-5 inches |
| Arid | 8-16 inches |
Visual Aid Idea:
Use paper raindrops or blocks to represent rainfall:
- 1 raindrop = 1 inch
Show: 4 columns/jars with the right number of raindrops for each desert.
Ask:
- “Which desert gets the most rain?”
- “Which gets the least?”
- “Can we count the raindrops together?”
📊 3. Numeracy Activity: Bar Graph (10–15 mins)
Materials:
- Bar graph poster or individual worksheet
- Raindrop stickers, cut-outs, markers, crayons
- Labels for each desert
Instructions:
- Students place the correct number of raindrops or color bars on the graph.
- Practice counting out loud together.
Support:
- Encourage “more than / less than” conversations.
- Challenge advanced students to order the deserts from wettest to driest.
🎨 4. Optional Craft: Desert Animals (5–10 mins)
Let each child pick a desert animal to color, craft, or draw.
Examples:
- Camel (Hot and Dry)
- Penguin or Arctic Fox (Cold)
- Lizard (Coastal)
- Jackrabbit (Arid)
Label the animal and its desert type.
🧠 Wrap-Up Discussion (3–5 mins)
Ask:
- “Which desert had the most rain?” (Arid – 10 inches)
- “Which had the least?” (Hot and Dry – 1 inch)
- “Do all deserts look the same?”
Key Vocabulary:
- Desert
- Rainfall
- Inches
- More / Less
- Bar Graph
Would you like me to create printable versions of:
- A bar graph worksheet
- Raindrop cut-outs
- Desert animal matching cards?
Let me know!